This article might be a bit outdated on some parts but just Google if problems arise.
SNMP and MRTG graphs
Statistics and graphs are nice way to follow what the machine is doing. Just a little bit of configuration and scripts you can use f. ex. servers’, routers’ and firewalls’ operational statistical data from their Object Identifiers (OID) with the help of Simple Network Management Protocol (SNMP) and Management Information Base (MIB) which define the available OID functions.
For more detailed how-to, check out: http://www.siliconvalleyccie.com/linux-hn/mrtg.htm#_Toc92809393 or a bit Gentoo specific guide http://forums.gentoo.org/viewtopic-t-105865-highlight-mrtg+rrdtool.html
Tools for the job
From Gentoo package-format:
* [net-analyzer/net-snmp]
* [net-analyzer/mrtg]
* [net-analyzer/rrdtool]
* [net-www/apache]
SNMP
We want to restrict the use of SNMP to local network so we edit SNMP’s config file which contains the community string and other parameters. Our selected community string here is “humppa”.
/etc/snmp/snmpd.conf
com2sec    local    localhost    humppa
com2sec    network_1    172.168.1.0/24    humppa
com2sec    network_2    192.168.1.0/24    humppa

group    MyROGroup    v1    local
group    MyROGroup    v1    network_1
group    MyROGroup    v1    network_2

view    all-mibs    included    .1    80

access   MyROGroup  ""  v1  noauth  0  all-mibs  none  none
So now:
- only 3 networks (localhost, 172.168.1.0/24, and 192.168.1.0/24) are allowed to use SNMP with humppa community string.
- Every network is on the MyROGroup and defined to use SNMP version 1 protocol with all MIBs.
- Only Reading the MIBs is allowed and thus the write section is “none”.
Start the SNMP service:
root@pikseli ~ # /etc/init.d/snmpd start
* Starting net-snmpd ... [ ok ]
Add the service to always start after reboots:
 ~ # rc-update add snmpd default
 * snmpd added to runlevel default
 * rc-update complete.
Test that the SNMP works with snmpwalk
~ # snmpwalk -v 1 -c humppa localhost system
SNMPv2-MIB::sysDescr.0 = STRING: Linux pikseli 2.6.11-ck1 #1 Fri Mar 4 01:59:56 EET 2005 x86_64
SNMPv2-MIB::sysObjectID.0 = OID: NET-SNMP-MIB::netSnmpAgentOIDs.10
SNMPv2-MIB::sysUpTime.0 = Timeticks: (13374) 0:02:13.74
SNMPv2-MIB::sysContact.0 = STRING: xyz@qwe.fi
SNMPv2-MIB::sysName.0 = STRING: mysupercomputer
...
...
~ # snmpwalk -v 1 -c humppa localhost interface
IF-MIB::ifNumber.0 = INTEGER: 3
IF-MIB::ifIndex.1 = INTEGER: 1
IF-MIB::ifIndex.2 = INTEGER: 2
IF-MIB::ifIndex.3 = INTEGER: 3
IF-MIB::ifDescr.1 = STRING: eth0
IF-MIB::ifDescr.2 = STRING: lo
IF-MIB::ifDescr.3 = STRING: eth1
...
...
~ #
MRTG
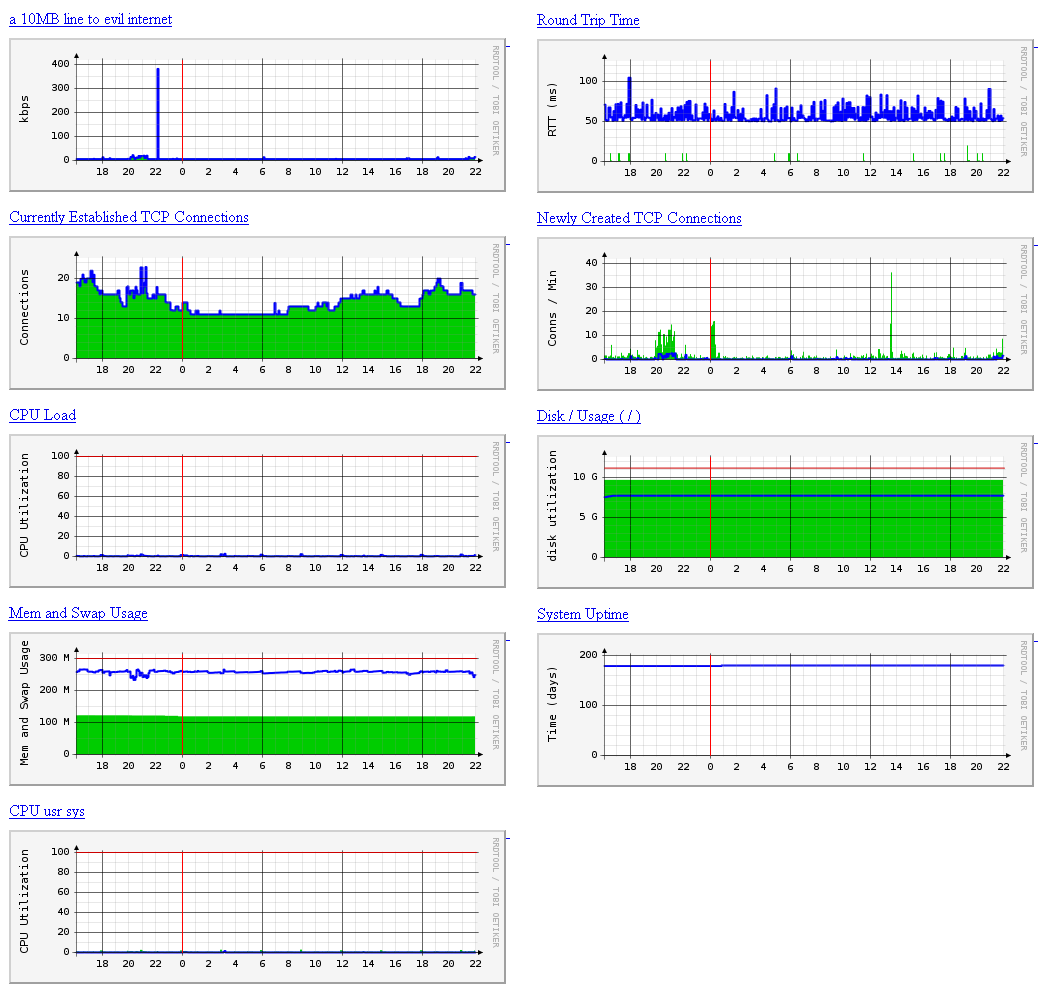
MRTG (Multi-Router Traffic Grapher) is a tool to draw some graphs from different statistical sources and they can look like the image on the right.
Configuring MRTG
MRTG’s config file is usually found in /etc/mrtg/mrtg.cfg and the resulting files are usually found under the Web Server’s root (f. ex. /var/www/mrtg/).
Mrtg Config:
LogFormat: rrdtool
EnableIPv6: no
Options[_]: bits,growright

# System: My Super Computer
# Description: Linux mysupercomputer
# Contact: -
# Location: Finland

# Global configuration
LoadMIBs: /usr/share/snmp/mibs/UCD-SNMP-MIB.txt, \
/usr/share/snmp/mibs/TCP-MIB.txt, \
/usr/share/snmp/mibs/HOST-RESOURCES-MIB.txt

Title[server.net]: a 10MB line to Internet
PNGTitle[server.net]: Internet Traffic
PageTop[server.net]: <H1>Link to the Internet</H1>
Target[server.net]: 1:humppa@localhost
MaxBytes[server.net]: 10000000
YLegend[server.net]: kbps
Options[server.net]: growright

# Established TCP Connections
Target[server.estabcons]: tcpCurrEstab.0&tcpCurrEstab.0:humppa@localhost
Title[server.estabcons]: Currently Established TCP Connections
PNGTitle[server.estabcons]: Currently Established TCP Connections
PageTop[server.estabcons]: <H1>Established TCP Connections</H1>
MaxBytes[server.estabcons]: 10000000000
ShortLegend[server.estabcons]:
YLegend[server.estabcons]: Connections
LegendI[server.estabcons]: In
LegendO[server.estabcons]:
Legend1[server.estabcons]: Established connections
Legend2[server.estabcons]:
Options[server.estabcons]: growright,nopercent,gauge

# New TCP Connection Monitoring (per minute)
Target[server.newconns]: tcpPassiveOpens.0&tcpActiveOpens.0:humppa@localhost
Title[server.newconns]: Newly Created TCP Connections
PNGTitle[server.newconns]: Newly Created TCP Connections
PageTop[server.newconns]: <H1>New TCP Connections</h1>
MaxBytes[server.newconns]: 10000000000
ShortLegend[server.newconns]: c/s
YLegend[server.newconns]: Conns / Min
LegendI[server.newconns]: In
LegendO[server.newconns]: Out
Legend1[server.newconns]: New inbound connections
Legend2[server.newconns]: New outbound connections
Options[server.newconns]: growright,nopercent,perminute

Target[server.cpu]:ssCpuRawUser.0&ssCpuRawUser.0:humppa@localhost + \

ssCpuRawSystem.0&ssCpuRawSystem.0:humppa@localhost + \

ssCpuRawNice.0&ssCpuRawNice.0:humppamachine@localhost
RouterUptime[server.cpu]: humppa@localhost
MaxBytes[server.cpu]: 100
Title[server.cpu]: CPU Load
PNGTitle[server.cpu]: CPU Load
PageTop[server.cpu]: <H1>Active CPU Load %</H1>
Unscaled[server.cpu]: ymwd
ShortLegend[server.cpu]: %
YLegend[server.cpu]: CPU Utilization
Legend1[server.cpu]: Active CPU in % (Load)
Legend2[server.cpu]:
Legend3[server.cpu]:
Legend4[server.cpu]:
LegendI[server.cpu]:  Active
LegendO[server.cpu]:
Options[server.cpu]: growright,nopercent

Target[server.rootdisk]:hrStorageSize.4&hrStorageUsed.4:humppa@localhost * 4000
MaxBytes[server.rootdisk]: 12000000000
Unscaled[server.rootdisk]: dwym
Title[server.rootdisk]: Disk / Usage ( / )
PNGTitle[server.rootdisk]: Disk / Usage ( / )
PageTop[server.rootdisk]: <H1>Disk / Usage ( / )</H1>
ShortLegend[server.rootdisk]: B
kilo[server.rootdisk]: 1024
YLegend[server.rootdisk]: disk utilization
Legend1[server.rootdisk]: / disk size
Legend2[server.rootdisk]: / disk used
Legend3[server.rootdisk]:
Legend4[server.rootdisk]:
LegendI[server.rootdisk]:  / disk size
LegendO[server.rootdisk]:  / disk used
Options[server.rootdisk]: growright, gauge,nopercent

Target[server.usrsys]: ssCpuRawUser.0&ssCpuRawSystem.0:humppa@localhost
Title[server.usrsys]: CPU usr sys
PNGTitle[server.usrsys]: CPU usr sys
MaxBytes[server.usrsys]: 100
PageTop[server.usrsys]: <H1>Active CPU Load (usr sys) %</H1>
Unscaled[server.usrsys]: ymwd
ShortLegend[server.usrsys]: %
YLegend[server.usrsys]: CPU Utilization
Legend1[server.usrsys]: % (usr)
Legend2[server.usrsys]: % (sys)
Legend3[server.usrsys]:
Legend4[server.usrsys]:
LegendI[server.usrsys]: % (usr)
LegendO[server.usrsys]: % (sys)
Options[server.usrsys]: growright, nopercent
Checking the MRTG config
Execute the script env LANG=C /usr/bin/mrtg /etc/mrtg/mrtg.cfg 3 times. You get some errors but don’t worry.
Create or uncomment the following line in your cron.d so you get regularly updated graps (once in a 5 minutes)
/etc/cron.d/mrtg
0-59/5 * * * * root env LANG=C /usr/bin/mrtg /etc/mrtg/mrtg.cfg > /dev/null 2>&1
Finally create a index page for MRTG (f. ex. http://localhost/mrtg/index.html) with
~ # indexmaker --output=/var/www/mrtg/index.html \
 --title="Power of Tech Under Control :)" \
 --sort=name \
 --enumerate \
 /etc/mrtg/mrtg.cfg
MRTG ja RRDtool
MRTG can log data with RRDtool which is better than the default log format. Just use the “LogFormat: rrdtool” line and you’re done. There is more information about RRDtool and MRTG on Oetiker’s site.
mrtg-rrd
“The mrtg-rrd.cgi is a CGI/FastCGI script for displaying MRTG graphs from data in the RRDtool format. It can make your monitoring system faster because MRTG does not have to generate all the PNG files with graphs every 5 minutes or so. Instead of this the graphs are generated on-demand when the user wants to see them.” http://www.fi.muni.cz/~kas/mrtg-rrd/
To use Mrtg-rrd.cgi just download it from the link above and place it on Apache’s cgi-bin -directory.
Extra scripts for extra statistics
Memory and Swap usage
The script: mem.pl
Lines for the mrtg.cfg:
Target[server.mem-swap]: `/usr/local/sbin/mem.pl`
Title[server.mem-swap]: Mem and Swap Usage
Unscaled[server.mem-swap]: dwym
MaxBytes[server.mem-swap]: 300000000
PageTop[server.mem-swap]: <H1>Mem and Swap Usage</H1>
#kMG[server.mem-swap]: k,M,G,T,P
LegendI[server.mem-swap]: Swap
LegendO[server.mem-swap]: Mem
Legend1[server.mem-swap]: Swap
Legend2[server.mem-swap]: Mem
YLegend[server.mem-swap]: Mem and Swap Usage
ShortLegend[server.mem-swap]:
Options[server.mem-swap]: gauge,nopercent
Ping Round Trip Time
The script: ping.sh
Lines for the mrtg.cfg:
# Ping
Title[server.ping]: Round Trip Time
PNGTitle[server.ping]: Round Trip Time
PageTop[server.ping]: <H1>Round Trip Time</H1>
Target[server.ping]: `/usr/local/sbin/ping.sh`
MaxBytes[server.ping]: 2000
Options[server.ping]: growright,unknaszero,nopercent,gauge
LegendI[server.ping]: Pkt loss %
LegendO[server.ping]: Avg RTT
Legend1[server.ping]: Maximum Round Trip Time in ms
Legend2[server.ping]: Minimum Round Trip Time in ms
Legend3[server.ping]: Maximal 5 Minute Maximum Round Trip Time in ms
Legend4[server.ping]: Maximal 5 Minute Minimum Round Trip Time in ms
YLegend[server.ping]: RTT (ms)
Uptime in days
The script: uptime.pl
And the lines for the mrtg.cfg:
Title[server.uptime]: System Uptime
PNGTitle[server.uptime]: System Uptime
PageTop[server.uptime]: <H1>System Uptime</H1>
Target[server.uptime]: `/usr/local/sbin/uptime.pl`
MaxBytes[server.uptime]: 1000
ShortLegend[server.uptime]: days
Options[server.uptime]: growright,unknaszero,nopercent,gauge
LegendI[server.uptime]: Uptime
LegendO[server.uptime]:
Legend1[server.uptime]: Maximum uptime in days
YLegend[server.uptime]: Time (days)
Apache hits and traffic
I googled for some scripts to get Apache statistics but found none. Luckily I had one on my harddrive which does the trick. Just don’t remember where I got it.
The trick is to enable “server-status” -information in Apache’s configuration. Your httpd.conf needs to include something like the following:
    SetHandler server-status
    Order allow,deny
    Allow from localhost

ExtendedStatus On
After that you can see Apache status in http://localhost/server-status.
Next step is the script: webstats.pl.
The lines for the MRTG are:
# Apache bytes
# server-info gives us kBytes, original script outputs bytes
Target[server.apache-tkbytes]: `/usr/local/sbin/webstats.pl bytes`
Title[server.apache-tkbytes]: Apache Traffic
PNGTitle[server.apache-tkbytes]: kBytes per second
MaxBytes[server.apache-tkbytes]: 256000
PageTop[server.apache-tkbytes]: <h2>Apache traffic</h2>
#Unscaled[server.apache-tkbytes]: ymwd
ShortLegend[server.apache-tkbytes]: kB/s
YLegend[server.apache-tkbytes]: kBytes/second
LegendI[server.apache-tkbytes]:
LegendO[server.apache-tkbytes]:
Options[server.apache-tkbytes]: growright, nopercent, noinfo, nobanner, integer,noi

# Apache hits
Target[server.apache-thits]: `/usr/local/sbin/webstats.pl hits`
PageTop[server.apache-thits]: <h2>Apache Hits</h2>
Title[server.apache-thits]: Apache Hits
Options[server.apache-thits]:  growright, nopercent, perhour,nobanner, noinfo, integer, noi
MaxBytes[server.apache-thits]: 12000
YLegend[server.apache-thits]: hits/hour
ShortLegend[server.apache-thits]: hits/hour
WithPeak[server.apache-thits]: wmy
LegendI[server.apache-thits]:
LegendO[server.apache-thits]:
Legend2[server.apache-thits]: Hits per hour
Legend4[server.apache-thits]: 5 minute Peak
Postfix stats: mails sent and received
Joel Knight at packetmischief.ca has a nice script for getting stats from Postfix. The idea is to “determine the number of email messages delivered locally and abroad per unit time and to graph that data.” There is also Craig Sanders’s script to provide same kind of results but I found the Joel Knight’s script to be little better.
The whole thing is documented on those pages so check them out and get some nice statistics. The difference between Joel’s and Craig’s scripts is that with Joel’s script you can also draw graphs of rejected mails.
Gongrats! You’re all done;
Leave a Reply