Tag: javaee
-
Book: Real World Java EE Night Hacks
Reading software development related books can be said to be unnecessary as all the information can be also found from the Internet but sometimes it’s easier to read all the related topics from one place. Adam Bien’s “Real World Java EE Night Hacks: Dissecting the Business Tier” is a book which walks through best practices…
-
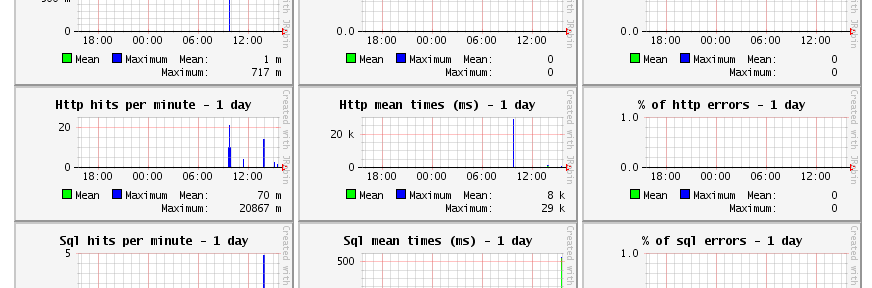
Monitoring Java EE application with JavaMelody
Software development is much more than just coding application by requirements and deploying it to production as the real work really starts after it has been shipped: maintenance, improvements and problem solving. And for that it’s good to have some data. It’s said “if you can’t measure it, you can’t improve it” and in ideal…