Software development is much more than just coding application by requirements and deploying it to production as the real work really starts after it has been shipped: maintenance, improvements and problem solving. And for that it’s good to have some data. It’s said “if you can’t measure it, you can’t improve it” and in ideal situations you plan for measuring your app but often you have to do it in production to detect and diagnose performance problems. There are different ways to measure a Java EE application and one good tool to achieve performance and monitoring statistics is Javamelody which has low overhead, is non-intrusive, informative and simple to setup but still very capable.
“If you can not measure it, you can not improve it.” – Lord Kelvin
Application performance can be measured by two main methods: computational resources used by the application and the performance as seen by a user of the application. By measuring these quantities we get an empirical performance baseline of the application which then can used to detect changes in performance. By using performance monitoring, which is an act of non-intrusively collect or observe performance data from running application, we get measurements to identify or isolate potential issues from real operation of an application without having a severe impact on runtime responsiveness or throughput.
There are different ways to achieve performance and monitoring statistics and it’s useful to plan for measuring application’s performance while still in development as later on you surely want to know how it is performing. You can do it by leveraging different JMX-based tools like Metrics and Servo but if you didn’t really plan for it you still have choices. You can use tools like standard JDK tools (jconsole, jstat, jmap, jstack, hprof) for low level JVM monitoring or some monitoring application like Javamelody. And as time is always scarce in development it’s useful to deploy a tool like JavaMelody which provide quick and easy access to performance monitoring. But if you are interested of some narrow focus measurement you’re better of with some custom tool.
Monitoring with JavaMelody
JavaMelody is an open source (LGPL) application to monitor Java or Java EE application servers in QA and production environments. It is a tool to measure and calculate statistics on real operation of an application depending on the usage of the application by users and is mainly based on statistics of requests and on evolution charts which can be viewed on the current day, week, month, year or custom period. The statistics can be viewed on a HTML page and sent as PDF reports by email.
JavaMelody lists the following use cases:
- It allows to improve applications in QA and production
- Give facts about the average response times and number of executions
- Make decisions when trends are bad, before problems become too serious
- Optimize based on the more limiting response times
- Find the root causes of response times
- Verify the real improvement after optimization
Setting up
Setting up JavaMelody is quite easy and the needed steps are covered in User guide. Integrating JavaMelody to your application can be done in less than 10 minutes, by automatic discovery of environment: it only requires to copy 2 jar files and to add 10 lines in a xml file. But for more detailed and wider measurements you need couple more lines to xml files and here are the changes I made for our Wicket, Spring, JPA, Hibernate -Java EE project.
JavaMelody and dependencies
Getting JavaMelody and it’s dependencies is easy with Maven2 and you just need to add javamelody-core and if you want to have PDF reports also iText in your pom.xml:
<dependency>
	<groupid>net.bull.javamelody</groupid>
	<artifact>javamelody-core</artifact>
	<version>1.45.0</version>
</dependency>

<dependency>
	com.lowagie
	itext
	<version>2.1.7<version>
	<exclusions>
		<exclusion>
			<groupid>bcmail-jdk14</groupid>
			<artifact>bouncycastle</artifact>
		</exclusion>
		<exclusion>
			<groupid>bcprov-jdk14</groupid>
			<artifact>bouncycastle</artifact>
		</exclusion>
		<exclusion>
			<groupid>bctsp-jdk14</groupid>
			<artifact>bouncycastle</artifact>
		</exclusion>
	</exclusions>
</dependency>
Monitoring application
JavaMelody needs just a monitoring filter before the description of webapp’s servlet in WEB-INF/web.xml or not even that as described in the User guide. But usually you want a little bit more than the minimum 10 additional lines in web.xml.
By adding the customResourceFilter you get customized look & feel, you can exclude some urls from statistics with url-exclude-pattern regular expression pattern, eamil-parameters are for weekly reports and by including monitoring-spring.xml you can monitor DataSource with a Spring post-processor and objects initialized with Spring.
...

	contextConfigLocation

		classpath:net/bull/javamelody/monitoring-spring.xml
		classpath:applicationContext-service.xml
		classpath:applicationContext-persist.xml
		classpath:applicationContext-web.xml
		classpath:applicationContext-security.xml


	springSecurityFilterChain
	org.springframework.web.filter.DelegatingFilterProxy


	springSecurityFilterChain
	/*


	customResourceFilter
	net.bull.javamelody.CustomResourceFilter

		monitoring.css
		/styles/monitoring.css


	customResourceFilter
	/monitoring


	monitoring
	net.bull.javamelody.MonitoringFilter

		storage-directory
		logs/monitoring


		url-exclude-pattern
		(/images/.*|/js/.*|/styles/.*)


		admin-emails
		first.last@example.com


		mail-session
		MailSession


		mail-periods
		week,month


	monitoring
	/*


	net.bull.javamelody.SessionListener

...
Spring Security config
For restricting the access to monitoring statistics I added the following to the Spring Security’s applicationContext-security.xml. There are also other options for security. The key point here is to make sure, that the monitoring-filter in web.xml (above) is defined after the Spring Security filter chain.
...
Monitoring SQL and datasources
For monitoring datasources and SQL I just added jndi-lookup to applicationContext-persist.xml. Other options to enable JDBC monitoring are described in the User guide.
...


...
Business facades (Spring)
If the application to monitor contains some objects initialized by Spring, EJB or Guice their methods execution can also be added to statistics. As described in the User guide for monitoring Spring Business facades there are couple of options and for example with JdkRegexpMethodPointcut in applicationContext-web.xml you can catch objects with regular expression like “all that have Service in their names”.
...


...
EHCache statistics
If you want to see also EHCache statistics add statistics=”true” to ehcache.xml config file.
Database information and statistics
JavaMelody already shows datasource and SQL information but it’s also possible to display information and statistics on the database like the longest requests in cumulative time with display of the cpu time and of the elementary cost. For showing that information the user in the database used by the monitored application must have the necessary rights to read those information and statistics.
In Oracle database the request practically means select * from v$session and you can grant access as ‘system’ user with GRANT SELECT any dictionary TO myapplicationuser. Strangely granting just the select for v$session (GRANT SELECT ON sys.v_$session TO myapplicationuser;) wasn’t enough.
Reports
There is also a possibility to get weekly, daily or monthly report in pdf format sent by email to one or several people. It needs iText library for webapp and Java’s JavaMail and Activation libraries in your server for the mail session.
With WebLogic you add some email parameters in webapp’s web.xml (above) and configure a Mail Session in WebLogic AdminServer: Services > Mail Sessions with JNDI Name and JavaMail properties. The report provides the same information you can find in monitoring web page with high and detailed level information.
Statistics’ storage
Javamelody data is stored in files on disk and there are 2 types of files: *.rrd files for values in graphics in RRD format (using jrobin library) and *.ser.gz for values in statistics.
The performance statistics are stored to temp/javamelody directory by default which means /tmp/javamelody in Linux and in Windows when running webapp in Eclipse something like Users/developer/AppData/Local/Temp/javamelody. If you want to reset the counters just delete all the files. The location can be changed with storage-directory parameter and if the name of the directory starts with ‘/’, it is considered as an absolute path, otherwise it is considered as relative to the temporary directory.
There is also option to use centralized collect server to store statistics and for monitoring of several applications.
Viewing performance monitoring
After you have set up your webapp to have the monitoring you can see statistics at URL like http:////monitoring depending your configuration.
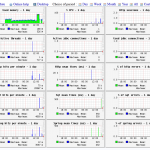
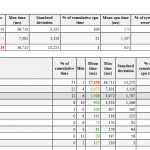
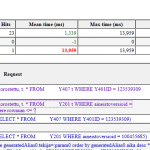
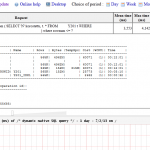
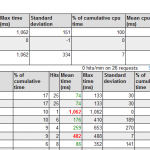
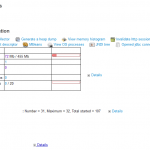
Some example JavaMelody statistics from development:
Overhead
Monitoring and filtering doesn’t come without costs and there has been discussions on JavaMelody wiki about the overhead the monitoring does. It is said that the overhead is so low that it can be enabled continuously in Quality Assuarance environment and if no problem arises in QA, also continuously in production environment. And with little overhead you will be able to know what needs optimizing in the QA or production servers so that the overhead of JavaMelody will practically be negative.
The discussion contained some notes:
- Architecture of JavaMelody is lightweight so it has a lower overhead as compared it to other available solutions
- It is only statistics and not events so the overhead of memory is quite minimal.
- It does monitoring not profiling: there is no instrumentation of classes and instead “interceptors” for http, jdbc, spring or ejb3.
- No database and no recording of each events even in a file or over the wire: only statistics of requests are kept. The overhead of cpu is minimal with no I/O on the wire and minimal I/O on disk (just to take a backup of statistics at a regular interval). The overhead of some other good monitoring solutions is in the recording of each event in a database or in a master server.
- You have the choice to use centralized collect server which unloads the memory, the backup storage and the generation of reports to another server while adding I/O on the wire for sending deltas of the statistics.
Summary
“If you can not measure it, you can not improve it.” It doesn’t matter how you do it but if you want to use real user data and environment just do it non-intrusively with performance monitoring tools like Javamelody.
Leave a Reply