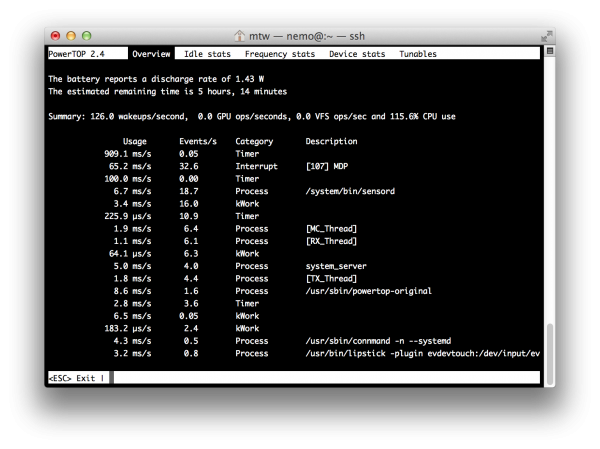
Lately my simple news feed reader, Ampiaiskala, got rejected from Jolla Store in Harbour Quality Assurance as it seemed that it was too power hungry while minimized. I was a bit surprised as 0.1 version was accepted and the functionality hadn’t changed. So, it was time to get familiarized with PowerTOP and how to debug problems with power consumption.
First we need to install PowerTOP to Jolla and then just ran it via SSH over USB or WLAN while the app is minimized and screen is closed. After that it’s about what all those numbers mean and where they come from.
Installing PowerTOP on Jolla
Steps to install PowerTOP from command line:
1. Add mer-tools repository:
$ ssu ar mer-tools
2. Refresh repository cache:
$ pkcon refresh
3. Install tool:
$ pkcon install powertop
4. Run tool:
$ devel-su powertop
Debugging power consumption
PowerTOP reports how much power each process uses and provides a list of all running processes which are waking up and how many times in a second (how many times each one sends a CPU interrupt). Only one process is monitored so it doesn’t tell all about the system, e.g. when the process has interaction with audio or network.
After installing PowerTOP tool, usage is easy via SSH over USB or WLAN connection. Difference between these connections is that device does not suspend with PC USB connection enabled and with WLAN device goes to suspend if there’s not any network traffic and display is turned off.
Connect to your phone e.g. with ssh nemo@192.168.1.58 and ran the PowerTOP as root: devel-su powertop. The command prompts you for the root password which you have given in Settings > System > Developer mode > SSH and root password.
Before starting to debug your app’s power consumption it’s useful to create a baseline by running PowerTOP after a cold startup, without opening any applications, and then run it a few more times throughout the day to get a comparison of different workloads.
Generate HTML page of PowerTOP results for baseline:
$ devel-su powertop --html=
After getting some baseline results it’s just reading the numbers and figuring out if your application eats power or not. And if it is power hungry beast then figuring out why it does that.
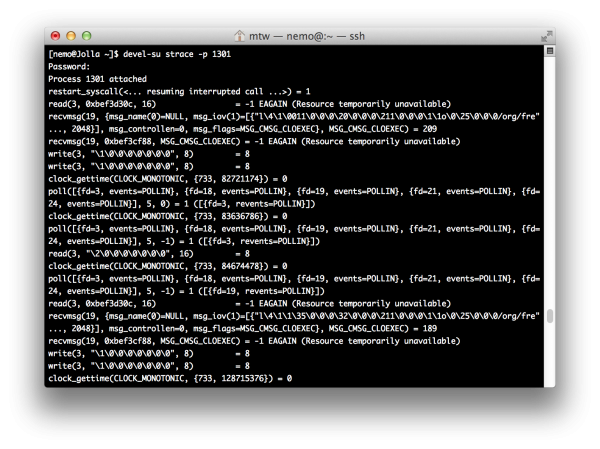
Complementary to PowerTOP, there’s Strace which lets you find out how a program is interacting with the operating system by monitoring system calls and signals. Just install it with $ pkcon install strace and ran it with strace -p or strace -ttT -p . It shows what your application does while it’s expected to be idle. For example:
$ ps aux | grep ampiaiskala
$ devel-su strace -p 1301
The result looks something like this:
Don’t ask me what all that means :)
Power consumption and Harbour QA testing
The reason I’m debugging my application for power usage is Jolla Harbour Quality Assurance which rejected my app with “It seems that app doesn’t go to idle state when device does”. The Quality Assurance procedure for power consumption is explained in Together being the following.
“Jolla’s Harbour QA testing is mostly done with PC USB cable connection, application minimized to home screen and display is turned off. In this state application should not block suspend and wake ups should be minimal (< ~60, this is a reference value). A good practice is to take a "system state" before opening application and compare those results when application is minimized to home screen." "The phone suspend is blocked by wake locks and easy test for that is catting /sys/power/wake_lock file. The file should be empty normally if nothing from user space is not blocking suspend. If application is using e.g. audio, then file should include “mce_cpu_keepalive” string. Of course applications are allowed to do things in the background but that should be minimal for its own functionality. E.g are internet streaming.”
After another Harbour QA rejection (2014-06-05) I asked in IRC from Jolla Sailor, nazanin, about the power consumption issue and what steps they are using so I could repeat them. The steps are the following:
- First there are no apps open, lock the device, run powertop command
- Wait for about 1 minute until the device status becomes stable
- Unlock it, open the application you want to test, play around with it for a bit, until the number of wake ups reaches 300 or 400
- Check if you already see the app in wakeup list in this status
- Lock the device and observe how powertop updates
- If after 1 minute or 2, the application drops down from the list, it’s okay
- If it doesn’t, then wait more, for about 5-10 minutes
- If you see the application is still there, that is when you can assume the test case is failed and application is causing power consumption
Possible reasons for excess power consumption
The procedure to figure out if your application is consuming power more than it should is relatively easy but finding out why it does that is a bit harder. Things like timers, animations, WebViews and using animated images are possible culprits and how the app behaves with none or bad network connectivity. I don’t know there to be any good tips how to debug these issues other than going through your app, knowing what it does and figuring out possible issues.
My own cases for Harbour QA rejections due power consumption have been with using SilicaWebview (QtWebKit) and keeping it open when the app is minimized and thus eating too much CPU and preventing the device go to sleep. The solution would be that you suspend the WebKit rendering or close the WebView. But that’s easier said than done. After discussing this issue in IRC with couple of Sailors (nazanin, kontio) for now there’s no good solution to suspend the WebKit as it doesn’t provide an easy API to suspend rendering. If it’s reasonable for user experience you can pop the WebView page when app is minimized. You can bind the action e.g. to CoverPage and use onStatusChanged signal and check for “status == PageStatus.Activating.
I came across this WebKit issue with Haikala and Ampiaiskala as they open WebKit view for reading the news feed item’s web page. For those I modified my code to allow the user to close the web view from the pull down menu when user goes back to the feed list. After that they passed the Harbour QA. Couple of months ago there was a similar case on SailfishDevel mailing list.
With my imgur app, Sailimgur, it was again using WebKit for viewing imgur’s gallery page but also there’s animated images running while showing the gallery or image page in the app. The app was seen under wake-ups when it was showing an animated image like .gif. If the app wasn’t showing some funny gifs from imgur it dropped down from the list after a while as it should. Understandable effect as the UI is running the gif which consumes power and prevents the device go to sleep.
The partial solution is to manually stop the animated images when the app is minimized but in my opinion that should be something that Sailfish OS should take care automatically. The other thing is the animated image running in the SilicaWebView where QtWebKit keeps running in the background and doesn’t suspend automatically. You could send SIGSTOP to suspend it when minimized and then continue with SIGCONT from C++ but it’s a bit hassle as you would need a monitoring process to manage that. And it’s not known if that works or not.
In the end after considering the options the Sailors said that they accept my app in the current state, since WebKit doesn’t provide an easy API to suspend rendering. But have to think about what I could do to limit wake-ups.


Leave a Reply