Monitoring Java applications is can be done with different tools and with JDK you get one good tool for it: Java Mission Control. Java Mission Control and Java Flight Recorder together create a complete tool chain to continuously collect low level and detailed runtime information enabling after-the-fact incident analysis. Starting with Oracle JDK 7 Update 40 (7u40) Java Mission Control (JMC) bundled with the HotSpot JVM. Let’s take a short look what those tools are.
“Java Flight Recorder is a profiling and event collection framework built into the Oracle JDK. It allows Java administrators and developers to gather detailed low level information about how the Java Virtual Machine (JVM) and the Java application are behaving. Java Mission Control is an advanced set of tools that enables efficient and detailed analysis of the extensive of data collected by Java Flight Recorder. The tool chain enables developers and administrators to collect and analyze data from Java applications running locally or deployed in production environments.” – Oracle Java Mission Control.
Java Mission Control and Java Flight Recorder are commercial features, which are available as part of the Oracle Java SE Advanced product. They are freely available for download for development and evaluation purposes, as per the terms in the Oracle Binary Code License Agreement, but require an Oracle Java SE Advanced license for production use.
Using Java Mission Control
Oracle Java Mission Control is a tool suite for managing, monitoring, profiling, and troubleshooting your Java applications and it consists of the JMX Console and the Java Flight Recorder. To get a good overview how you can use Java Mission Control check Java Mission Control demo video. The JMC Client is built to run on Eclipse and it’s based on the features of the old JRockit Mission Control.
The JMX Console enables you to monitor and manage your Java application and the JVM at runtime but the main and most important feature is the Flight Recorder. Java Flight Recorder (JFR) records the behavior of the JVM at runtime and you can analyze the recording offline using the Java Flight Recorder tool. They say that the overall profiling overhead for your applications stays at less than 2%, usually much less.
Starting with Oracle JDK 7 Update 40 (7u40) it’s bundled with the HotSpot JVM and although you can connect it to older JDK’s like application running on JDK 6 the newer ones show more information and have more features. So no real fun with legacy applications. The Flight Recorder needs at least JDK 7 Update 40.
Start JMC from the Windows command prompt:
"c:\Program Files\Java\jdk1.8.0_20\bin\jmc.exe"
Java Mission Control can be connected to local or remote Java Application. Start your application with following Virtual Machine flags which enables the JMX remote without authentication and Mission Control:
-Dcom.sun.management.jmxremote
-Dcom.sun.management.jmxremote.port=8999
-Dcom.sun.management.jmxremote.ssl=false
-Dcom.sun.management.jmxremote.authenticate=false
-XX:+UnlockCommercialFeatures
-XX:+FlightRecorder
If you’re using WebLogic then the JMX Remote settings are following:
-Djavax.management.builder.initial=weblogic.management.jmx.mbeanserver.WLSMBeanServerBuilder
-Dcom.sun.management.jmxremote.port=8999 -Dcom.sun.management.jmxremote.ssl=false
-Dcom.sun.management.jmxremote.authenticate=false
-XX:+UnlockCommercialFeatures
-XX:+FlightRecorder
JMC does not include or run with a security manager, so a user must ensure to run the JMC client in a secure environment.
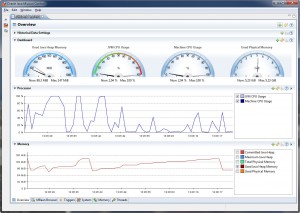
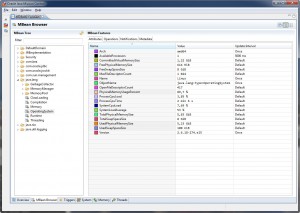
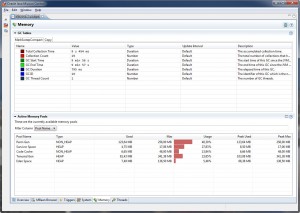
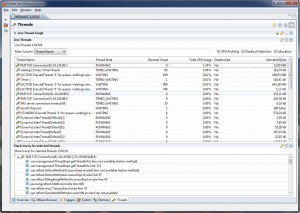
After connecting JMC with your Java application it opens a familiar Eclipse based user interface. JMX Console has couple of tabs on the bottom which shows overview, MBeans, Memory and Thread information.
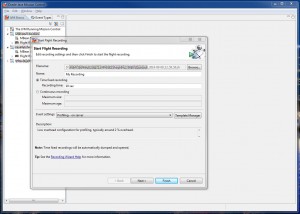
The more useful tool is the Java Flight Recorder (JFR) for profiling your application. In Java Mission Control JVM Browser right click on the Java Virtual Machine you wish to start a Flight Recording.
Leave all the default settings and select the “Profiling – on server” template for your Event Settings. Just hit finish at this point. You can also click Next to go to the higher level event settings which are groupings of named settings in the template. You can select how often you want JFR to sample methods by changing the Method Sampling setting.
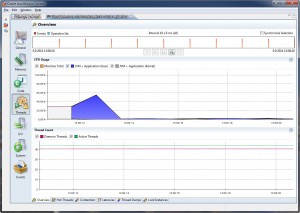
The recording will be downloaded automatically and displayed in Mission Control. Click the tab group for Code to start visualizing your Method Profiling Sample events. Switch to the method profiling tab to find a top list of the hottest methods in your application.
Too bad I don’t have nice recording to show but here’s couple of screenshots. Better overview of how to use Flight Recording can be seen from the Java Mission Control demo video.
Leave a Reply