Packaging your software can be done with different tools which bundles libraries and your code to groups of files (called chunks). Sometimes you might wonder why the chunks are so big and why some libraries are included although they are not used in some view (code splitting). There are different tools to analyze and visualize the bundles. For Webpack you can use Statoscope, webpack-xray or Webpack Bundle Analyzer. Here’s a short recap of those tools.
TL;DR;
Webpack stats are the key
It all starts with generating Webpack stats which the tools then use for analyzing bundles.
Generate Webpack stats:
$ webpack --json stats.jsonOr if you’re using vue-cli:
$ node_modules/.bin/vue-cli-service build --report-jsonStatoscope
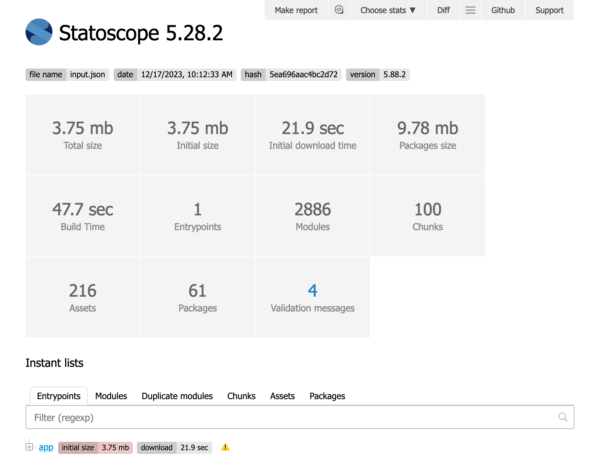
Statoscope is a toolkit for analyzing and validate stats of your bundle. It processes the stats, performs analysis and provides a visual representation to interpret the results in a convenient form.
- Visual interface to analyze bundles in real-time.
- Allows you to analyze modules, module maps, chunks and assets — all in one place.
- You can use it from the browser in the sandbox
- You can use it as a cli tool
Using the cli tool
Install:
$ npm i @statoscope/cli -gInstall webpack-plugin for the validator:
$ npm install --save-dev @statoscope/stats-validator-plugin-webpack @statoscope/stats-validator-reporter-console @statoscope/stats-validator-reporter-stats-reportCreate a statosope-config: statoscope.config.js
module.exports = {
  validate: {
    // add webpack plugin with rules
    plugins: ['@statoscope/webpack'],
    reporters: [
      // console-reporter to output results into console (enabled by default)
      '@statoscope/console',
      // reporter that generates UI-report with validation-results
      ['@statoscope/stats-report', { open: true }]
    ],
    // rules to validate your stats (use all of them or only specific rules)
    rules: {}
  }
}
Analyze:
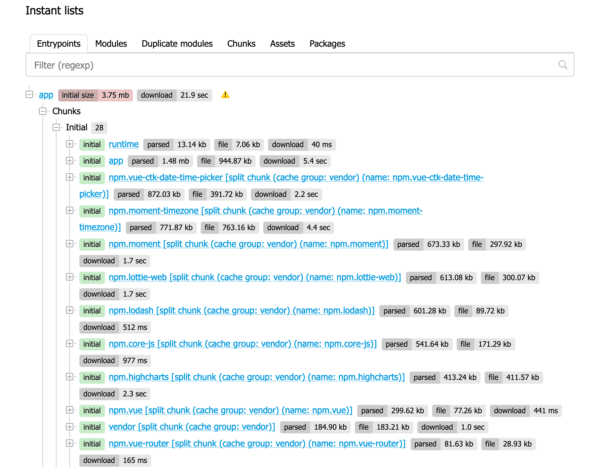
$ statoscope validate --input path/to/stats.jsonThe report will open to new browser window and you can see what the bundle contains and in my case where some library is loaded and why.
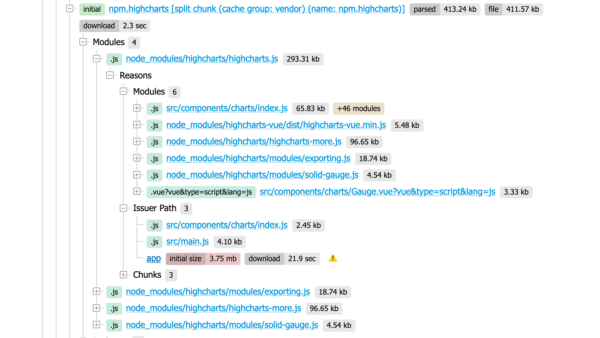
For example in my case I needed to see where the highcharts library was bundled:
Summary of Statoscope
+ Tells why a certain module was bundled and more
+ You can run it on browser
+ You can use it as a cli tool
– Installation and usage could be easier
– Needs extra webpack plugin dependencies even if using cli-tool
– Needs statoscope config even if using cli-tool and
Webpack-xray
Webpack-xray is a modern take on webpack/analyse powered by TypeScript, React, React-Table and Bulma.
You can use it from the browser or you can also use it offline:
- Clone the repository
- Run with:
npm run dev -- --open
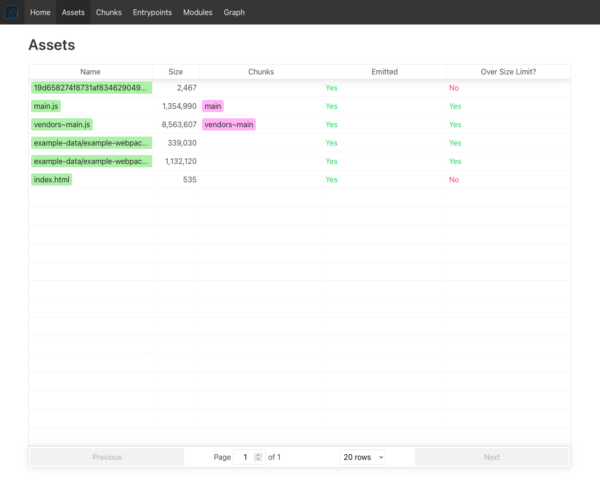
Example of webpack-xray analysis:
Summary of webpack-xray
+ Looks nice
+ You can run it on browser
+ You can use it as a cli tool
+ Doesn’t need extra dependencies to project
– Doesn’t support Webpack 5
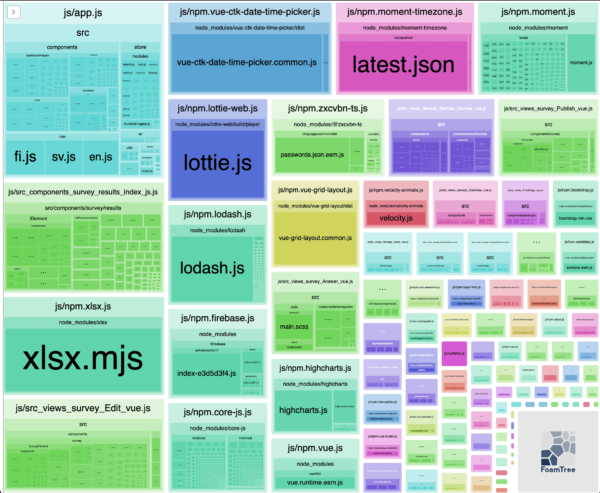
Webpack Bundle Analyzer
Webpack bundle analyzer visualizes size of webpack output files with an interactive zoomable treemap. Compared to the other tools mentioned here it provides only analyzing the internals of Webpack rather than stats.
Usage as cli tool
Install:
npm install --save-dev webpack-bundle-analyzerRun the tool:
webpack-bundle-analyzer bundle/output/path/stats.jsonThe analysis will open to new browser window and show what is inside your chunks.
Summary of webpack-bundle-analyzer
+ Shows what are inside bundles
– Doesn’t tell why a certain module was bundled
Leave a Reply