-

Getting ready for Fujitsu Forum 2013
In two weeks time it’s again that time of the year when business- and IT decision-makers, experts and specialists, project managers and IT architects, consultants and users travel to Germany to visit Fujitsu’s largest IT-event in Europe: Fujitsu Forum 2013. And that’s also the destination where I’m going as I’m one of the bloggers invited…
-
Do a clean install of Windows 8 with an upgrade key
There are times when you have to do a clean install of your Windows 8 but if you have just an upgrade key you need to make couple of extra hoops before you can activate the new install. The upgrade key doesn’t prevent you installing to a clean disk but when you try to activate,…
-
Auto-expand WP-Syntax code blocks
Hilighting code blocks in Worpdress blog posts can be achieved with different plugins and one of them is the WP-Syntax plugin which uses GeSHi source code highlighting and supports a wide range of popular languages, highlighting with or without line numbers and maintains formatting while copying snippets of code from the browser.… Jatka lukemista →
-
Using PHP-FPM with Apache 2 on CentOS
Running Apache 2 and PHP is simple with mod_php but there are more efficient alternatives like using PHP-FPM (FastCGI Process Manager) which is an alternative PHP FastCGI implementation. With it the PHP process runs standalone without the need for a web server and listens for incoming requests on either a TCP or a Unix socket.……
-
Maven plugin to generate HTML from Markdown
Writing documentation or user guide isn’t the most interesting part of the software project but it’s still needed to be done and important for the end users. There are many ways to achieve documentation but using Markdown is good way to make it easier. After that you just need to convert it to HTML and…
-
Setting up LAMP stack on OS X
Setting up LAMP stack for web development on OS X can be done with 3rd party software like MAMP but as Mac OS X comes with pre-installed Apache and PHP it’s easy to use the native setup. You just need to configure Apache, PHP and install MySQL. Setup Apache2 Set up the Server Name to…
-
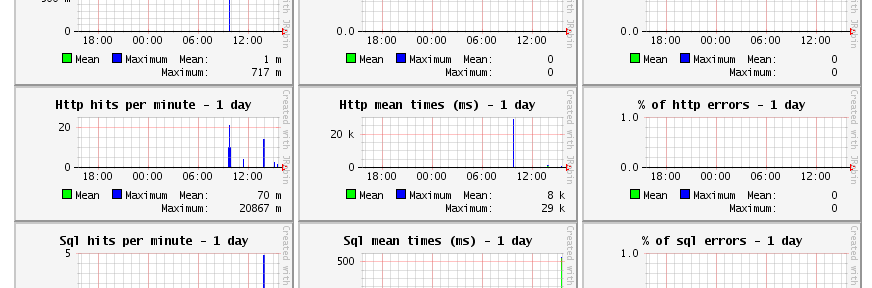
Monitoring Java EE application with JavaMelody
Software development is much more than just coding application by requirements and deploying it to production as the real work really starts after it has been shipped: maintenance, improvements and problem solving. And for that it’s good to have some data. It’s said “if you can’t measure it, you can’t improve it” and in ideal…
-
Weblogic Server Auto Restart with Node Manager as Linux service
Sometimes servers need to reboot and then it’s nice to have certain services to start automatically. Oracle Weblogic’s Node Manager is one of them and in order to have Node Manager start automatically it must be configured as a daemon. Unfortunately Oracle doesn’t provide init scripts to run it as a Linux service but it’s…
-
Web application test automation with Robot Framework
Software quality has always been important but seems that lately it has become more generally acknowledged fact that quality assurance and testing aren’t things to be left behind. With Java EE Web applications you have different ways to achieve test coverage and test that your application works with tools like JUnit, Mockito and DBUnit.… Jatka…
-
Patching RichFaces 3.3.3 AJAX.js for IE9
There are always some problems when working with 3rd party frameworks when the world moves forward but the framework you’re using doesn’t. After JSF 2 was released the RichFaces development moved to 4.x version and they dropped support for the older versions although many users are still using the older versions as it’s not trivial…